Cyber Apocalypse 2022 - Space Pulses
This challenge was part of the hardware category, and was pretty interesting. Here is the challenge description:
One of our enhanced radio telescopes captured some weird fluctuations from a nearby star. It was idle for decades due to the fact that it was fully enclosed by a Dyson Sphere but its patterns began to change drastically leading us to believe that someone is controlling part of the megastructure to release energy and send these pulses directed to us in order to transmit a message. They must have known that our equipment can read even the slightest fluctuations.
There was a downloadable file, which was a saleae logic file. This definitely isn't something easy like serial. It seems like it might have some time dependent information encoded, because the pulse time is not consistent. I started to suspect this might be some sort of pulse width modulation encoding scheme.

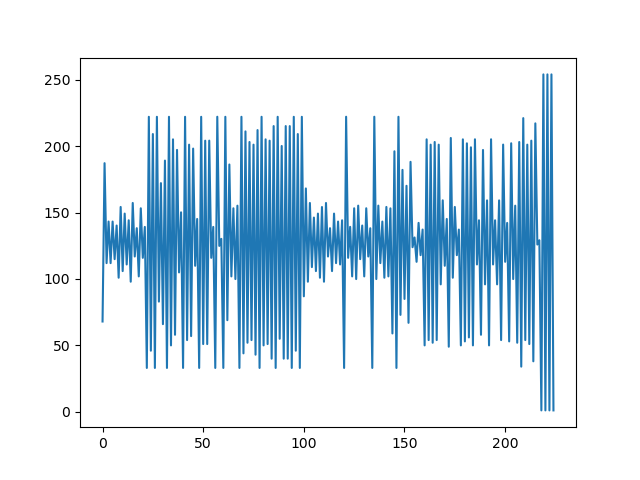
First, I exported the signal from Logic2 as a CSV so I could work with it. I started by plotting the time each pulse was on vs off. I knew the time was in seconds, so the pulse times would be small.
iimport numpy as np
from matplotlib import pyplot as plt

sig = np.genfromtxt('sp_digital.txt', delimiter=',', skip_header=0)
values = np.diff(sig[:,0])*1000

plt.figure()
plt.plot(values[2:-1])
plt.savefig('signal_plot.png')
plt.close()
That produced the following output:

That pretty much confirmed my suspicions that this was PWM. The time delta does not exceed 255 for any pulse, so that seems like it may be an ascii encoded string. Let's convert it.
rounded_values = np.round(values[::2])
floor_values = np.floor(values[::2])
ceil_values = int_values + 1

for v in [rounded_values, floor_values, ceil_values]:
    print(''.join([chr(int(x)) for x in v[1:]]))
I did not know whether my floating point values from the time delta should be rounded, floored, or ceiling-ed, so I did all 3. My script output the following:
Dppsejobuft!.!SB!2:i!69n!33t!}!Efd!,46+!23(!7((!.!Wbmjebujpo!tfdsfu!dpef;!IUC|qv2646`n1ev2582o:`2o`6q5d4"63&~
Coordinates - RA 19h 58m 22s | Dec +35* 12' 6'' - Validation secret code: HTB{pu1535_m0du1471n9_1n_5p4c3!52%}
Dppsejobuft!.!SB!2:i!69n!33t!}!Efd!,46+!23(!7((!.!Wbmjebujpo!tfdsfu!dpef;!IUC|qv2646`n1ev2582o:`2o`6q5d4"63&~
The only one that produced reasonable output was floor. The flag is in the last half of the message.
The full script is below:
import numpy as np
from matplotlib import pyplot as plt

sig = np.genfromtxt('sp_digital.txt', delimiter=',', skip_header=0)
values = np.diff(sig[:,0])*1000

plt.figure()
plt.plot(values[2:-1])
plt.savefig('signal_plot.png')
plt.close()

rounded_values = np.round(values[::2])
int_values = np.floor(values[::2])
ceil_values = int_values + 1

for v in [rounded_values, int_values, ceil_values]:
    print(''.join([chr(int(x)) for x in v[1:]]))